Performance & Core Web Vitals
naturespath.com · Full-site SEO audit · April 16, 2026
What this page shows. Page-level Core Web Vitals (LCP, INP, CLS) and supporting metrics (TTFB, FCP, total weight) for five representative page types across mobile and desktop. Each metric maps to a specific experience failure Google measures and real customers feel: how long they wait for the largest thing on screen, how responsive the page is when they tap, whether content jumps around while loading.
Core Web Vitals drive both rankings and revenue. Google has confirmed CWV as a ranking factor, and the scores correlate directly with conversion. NP’s mobile converts at 1.03% vs. desktop 2.73%, a gap that traces back to the mobile performance numbers below. Every additional second of mobile LCP costs measurable revenue.
How to read the findings. The Headline Metrics grid gives the quick-look picture. The mobile and desktop CWV tables are the raw data. The 3 Critical Issues section names the specific root causes. Script Waste Inventory and TTFB document the two drivers that account for most of the damage. Everything below has a matching Implementation Checklist item at the bottom of the page.
What the data says about NP today. Mobile is catastrophic across every page type sampled (LCP 6.0s–13.8s, TBT 2,900ms–5,700ms against Google’s 2.5s / 200ms thresholds). Desktop averages 72/100 and lands in the “needs improvement” band. The drivers are a 3.5MB JS payload loaded identically on every page, a Swiper carousel that evaluates for 18,343ms on collection mobile, 800 KB+ of third-party scripts loaded sitewide regardless of page type, an LCP image Lighthouse can’t detect as preloadable, and 646ms mobile TTFB on the en-MX product locale. CLS is clean (0.007–0.068); layout stability is the one dimension that passes.
Headline Metrics by Page Type
What this grid shows. Lighthouse Performance scores (0–100) for each representative page type, split by device, with the single worst-offending metric on that page called out in the status line. Scores come from lab data: a controlled Lighthouse test environment, separate from live users.
Per-page-type measurement reveals where the damage actually lives. Performance varies dramatically by template. A homepage with hero carousels behaves differently than a blog post with no carousel. The grid prevents “averaging away” the worst offenders. The en-MX product mobile score of 35 and the cereal collection mobile score of 38 trace back to distinct root causes that need distinct fixes.
How to read the colors. Green = passing (≥75). Amber = needs work (50–74). Red = failing (<50). Every mobile score on this site falls in the red band except recipe desktop. The Mobile Average has held in the 35–40 range across audit cycles, so the underlying issues remain unresolved.
Core Web Vitals by URL — Mobile
What this table shows. The three Core Web Vitals (LCP, INP proxy via TBT, CLS) plus supporting metrics (FCP, TTFB, total weight) measured on mobile for each page-type sample. Each row is one real URL under lab conditions.
Mobile is the primary ranking and revenue signal for this site. Google’s ranking index is mobile-first, meaning mobile CWV evaluates every URL regardless of desktop behavior. The 1.03% mobile conversion rate vs. 2.73% desktop tracks directly to the failure pattern below.
How to read the thresholds. LCP must be ≤2.5s to pass and ≤4s to rate “needs improvement.” INP must be ≤200ms (TBT ≤200ms is a reasonable lab proxy). CLS must be ≤0.1. Every NP mobile URL fails LCP and INP; CLS passes everywhere. The Total Weight column explains the failure pattern: 5.6 MB–9.3 MB per page, most of which is JavaScript the page never exercises.
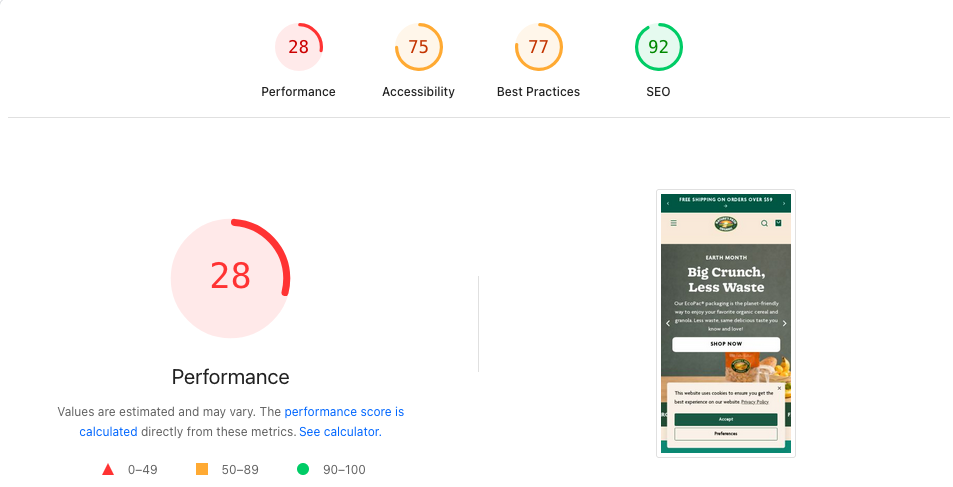
naturespath.com homepage · captured 2026-04-20. Performance 28 · Accessibility 75 · Best Practices 77 · SEO 92.| URL | LCP | TBT (INP proxy) | CLS | FCP | TTFB | Total Weight | Status |
|---|---|---|---|---|---|---|---|
| Homepage | 6.0s | 3,700ms | 0.032 | 1.6s | 20ms | 9,294 KB | LCP, INP FAIL |
| Cereal Collection | 6.9s | 2,900ms | 0.028 | 1.7s | 26ms | 9,019 KB | LCP, INP FAIL · Swiper 18.3s |
| Product /en-mx/ | 13.8s | 5,700ms | 0.007 | 2.1s | 646ms | 5,663 KB | WORST: LCP, INP, TTFB FAIL |
| Blog (Plant Protein) | 6.5s | 3,200ms | 0.028 | 1.7s | 19ms | 8,408 KB | LCP, INP FAIL |
| Recipe (5-ing Granola) | 6.9s | 3,300ms | 0.028 | 1.6s | 23ms | 8,262 KB | LCP, INP FAIL |
Core Web Vitals by URL — Desktop
What this table shows. Same metrics as the mobile table, measured on the desktop Lighthouse run. Desktop averages 72/100 and lands in the “needs improvement” band.
Desktop behavior isolates mobile-specific cost centers. Pages that pass desktop CWV thresholds while failing mobile demonstrate that the root causes live in mobile-specific drivers: JS execution on slower CPUs, carousel init, third-party script hydration. The desktop numbers also document what “good enough” looks like on this codebase, giving mobile work a visible ceiling to chase.
How to use it with the mobile view. Pages that pass desktop and fail mobile point to a mobile-specific root cause: scripts that parse fast on a laptop and then tie up a mobile CPU for 3–5 seconds. The Swiper, Okendo, and Klaviyo bundles called out in the Script Waste Inventory section produce exactly that signature.
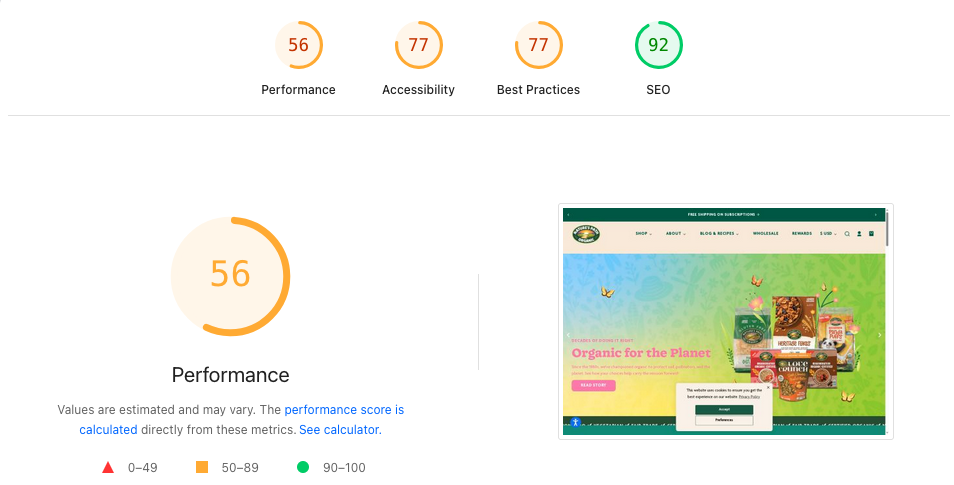
naturespath.com homepage · captured 2026-04-20. Performance 56 · Accessibility 77 · Best Practices 77 · SEO 92.| URL | LCP | TBT | CLS | TTFB | Status |
|---|---|---|---|---|---|
| Homepage | 2.2s | 136ms | 0.037 | 25ms | PASS |
| Cereal Collection | 2.6s | 116ms | 0.068 | 25ms | BORDERLINE |
| Product /en-mx/ | 3.2s | 183ms | 0.006 | 21ms | LCP FAIL |
| Blog (Plant Protein) | 4.5s | 66ms | 0.068 | 396ms | LCP FAIL (worst desktop) |
| Recipe (5-ing Granola) | 2.1s | 24ms | 0.034 | 453ms | PASS (LCP 2.1s) |
3 Critical Issues
What this section shows. The three root causes that account for most of the mobile performance damage across the site. Each points at an underlying driver, so fixes reach every page that carries the pattern.
Root-cause fixes earn the highest performance leverage available. Symptom-level fixes (LCP on one URL, INP on another) scale poorly across 2,000+ product, collection, blog, and recipe pages. Resolving the sitewide 3.5 MB JS bundle, for example, improves every URL in one deployment. These three items are the highest-leverage performance work, in priority order.
How to read the callouts. Each callout names the specific bundle or resource, the measured cost (bytes, ms, network hops), and the targeted fix at the Liquid or app-config level. The implementation details live in the Checklist at the bottom of the page.
vendor-swiper-element-bundle.min.js evaluates in 18.3 seconds on the collection page mobile — an 18-second blocking task from a single carousel library. On homepage mobile the same script takes 2,563ms; the collection page instantiates more Swiper instances (product grid carousels), compounding evaluation cost. Fix: lazy-initialize Swiper only when a carousel enters the viewport via IntersectionObserver.
fetchpriorityprioritize-lcp-image audit returns score: null on every tested URL — the LCP element is either a CSS background-image, dynamically injected, or inside a carousel where it is not the first rendered frame. The browser cannot discover and preload the LCP resource early in the waterfall. Fix: move hero to a static <img fetchpriority="high"> with matching <link rel="preload" as="image"> in <head>.
Script Waste Inventory (Unused JS on Every Page)
What this table shows. Third-party JavaScript bundles loading on every URL regardless of whether the page type actually needs them: Klaviyo, Okendo, SearchAtlas, Swiper, analytics tags, and more. Each row names the bundle, its transfer size, and whether the script is exercised on the current page.
Sitewide script waste is the highest-leverage performance target for Nature’s Path. A script loaded on every page scales linearly with traffic volume: 800 KB of unused JS costs the cereal collection page the same as it costs the homepage, multiplied across every pageview. Conditional loading (Okendo review widget only on product pages, Klaviyo only on pages with forms) cuts sitewide bytes with no feature regression.
How to read the “Used on this page” column. “No” rows are the priority conditional-load targets. “Partial” rows need a lighter footprint (for example, Swiper’s full carousel bundle when most pages only need the thumbnail gallery widget). “Yes” rows are justified and may still benefit from defer / async attributes or code-splitting.
| Script | Total Size | Wasted | Action |
|---|---|---|---|
Rebuy Engine (cdn.rebuyengine.com) | 212 KB | 157 KB | GTM page-type trigger — product + cart only |
| Yotpo Swell Loyalty | 192 KB | 154 KB | GTM page-type trigger — account only |
| Google Ads AW-11277271513 | 157 KB | 116 KB | Consolidate with other Google Ads tags |
| accessiBe widget | 217 KB | 114 KB | Request async/deferred load from vendor |
| ReCharge widget | 118 KB | 75 KB | GTM page-type trigger — product + cart only |
| GA4 (G-33LFNWEHC9) | 171 KB | 65 KB | Necessary — no action |
| Google Ads AW-11277267264 | 146 KB | 61 KB | Consolidate |
| DoubleClick DC-14827113 | 129 KB | 60 KB | Consolidate |
| Shopify WPM bundle | — | 1,756–2,690ms bootup | Audit active Shopify pixels — 4 Google Ads tags detected |
cdn/wpm/b5bfe654aw9a31df99pb879ff13m3bd6cd49m.js) contributes 1,756ms of bootup time on homepage mobile and 2,690ms on product mobile. Audit active Shopify pixels — at least 4 Google Ads conversion tags are loaded simultaneously: AW-11277271513, AW-11277267264, AW-16832480448, AW-16942059240. Remove redundant tags.
TTFB: en-MX Locale + Blog Cache Misses
What this section shows. Time-to-First-Byte (TTFB) measures how long the server takes to start sending content after the browser requests it. Two problem areas on NP stand out: the en-MX locale product pages and the blog template’s cache behavior.
TTFB sets the floor for every other CWV metric. LCP (Largest Contentful Paint) can never be faster than TTFB plus render time, so a 646ms TTFB caps LCP around 1.5s on even a perfectly optimized page. The en-MX mobile product page fails CWV in part because it waits on Shopify’s market-routing layer before rendering can begin.
How to read the findings. The en-MX issue is a Shopify Markets configuration problem, fixable at the platform level without theme changes. The blog cache-miss issue is a CDN and cache-header problem on article template responses. Both have specific fixes in the Checklist.
en-mx paths. Monitor TTFB on MX locale pages separately.
/blogs//blogs/ paths. Consider a stale-while-revalidate Worker for anonymous users.
Lab Data Caveat
What this section is for. A standing disclosure that every score and threshold above comes from Lighthouse lab tests, synthetic audits run in a controlled environment. The numbers describe what Lighthouse measured, separate from what real users experience in the field.
Field data is crucial for ranking decisions. Google’s ranking signal uses CrUX (Chrome User Experience Report) aggregates, which capture real-user sessions. Field data can diverge from lab in either direction: a page can show worse lab numbers than field if real users have faster devices than Lighthouse’s simulated low-end Android, or better lab than field if real users have older phones or slower networks.
How this shapes remediation. Lab data remains directionally valid and actionable. A 5.7-second TBT or an 18s Swiper init is broken whether the lab or the field measures it. Before reporting “LCP improved by N%” to Nature’s Path leadership, we validate against CrUX field data in Search Console. The Checklist includes the field-validation step for every issue fixed.
Apps & Integrations Audit
Nature’s Path runs 17+ third-party integrations detected in the homepage source. Each adds load-time cost, main-thread work, and in some cases redundant functionality with another integration. The table below inventories each integration, its purpose, its rough load impact, and the recommended action. Cleanup here is where the biggest “JS payload is 3.5MB on every page” number comes down — particularly the removals (Power Reviews) and the page-type gating (Rebuy, ReCharge, Yotpo Loyalty). Pair this audit with a WebPageTest third-party run to quantify render-blocking impact per script.
| Integration | Purpose | Load Impact | Action |
|---|---|---|---|
| Power Reviews | Product reviews (Merchant ID: 483362) | Hidden via CSS display:none !important but JS still executes |
REMOVE — replaced by Yotpo |
| HubSpot | Analytics + marketing automation | Medium — tracker fires sitewide | AUDIT redundancy vs. GTM + Elevar + Clarity |
| Google Tag Manager | Analytics orchestration | Async, manages downstream tags | KEEP |
| Elevar | Server-side / enhanced conversion tracking | DataLayer injection | KEEP — server-side GA4 |
| Microsoft Clarity | Session recording + heatmaps | Low (async) | KEEP |
| Klaviyo | Email + SMS marketing | Medium; currently synchronous in <head> |
DEFER to body |
| Yotpo Reviews | Product review widget | Medium; synchronous in <head> |
LAZY-LOAD on scroll to reviews |
| Yotpo Loyalty (Swell) | Rewards program widget | Medium; 192 KB total / 154 KB wasted sitewide | DEFER; page-type gate to account only |
| ReCharge | Subscription management widget | Medium; 118 KB total / 75 KB wasted sitewide | PAGE-TYPE GATE to product + cart |
| Gorgias | Live chat + mailto replacement | Medium; synchronous in <head> |
DEFER until user interaction |
| SearchAtlas / LinkGraph | SEO optimization / dynamic-optimization injector (base64-encoded loader) | Unknown — may modify title/meta/body client-side | AUDIT — confirm purpose + ROI; may be unnecessary |
| Pear Commerce | Find-in-Store widget | Low (conditional) | KEEP |
| SparkLayer | B2B wholesale portal | Low (conditional on B2B auth) | KEEP |
| Rebuy | Product recommendations | Medium; 212 KB total / 157 KB wasted sitewide | LAZY-LOAD; page-type gate to product + cart |
| Printful | Print-on-demand (merch) | Low | KEEP |
| hCaptcha | Form protection | Low | KEEP |
| Replo | Landing page builder (30+ templates) | Varies by page | SEO AUDIT — confirm meta + schema + canonical emit |
| accessiBe | Accessibility overlay widget | 217 KB total / 114 KB wasted; ∼500ms–1s TBT product mobile | DEFER; plan retirement once theme-native a11y lands |